If issues, such as instance stuttering or slow service responses, occur when you use a Linux Elastic Compute Service (ECS) instance, the CPU utilization or load of the instance may stay high. This topic describes how to troubleshoot and resolve the issues.
Problem description
When you use a Linux ECS instance, the following conditions exist:
The system becomes unresponsive, the responses of services are slow, or the performance of applications is downgraded.
You find that the CPU utilization or load of the instance is high in the ECS console. The CPU utilization is considered high if it is higher than 80%. The CPU load is considered high if it is greater than 0.5.
You receive an alert indicating that the CPU utilization or load exceeds a specific threshold.
Causes
The high CPU utilization or load issue may be caused by the following reasons:
Common reasons for high CPU utilization:
Abnormal processes or services consume a large amount of CPU resources.
The CPU performance of the instance is insufficient to meet the requirements of business programs and scenarios.
Common reasons for high CPU load:
A process consumes CPU resources for an extended period of time.
Disk or network I/O bottlenecks.
Troubleshoot the issue
The following section describes how to identify and troubleshoot the high CPU load issue.
Run the top command to view CPU resource usage for processes
The top command is a common performance analytics tool in Linux. It can display the resource usage of each process in the system in real time.
Command syntax
top [-n] [-d] [-n]: specifies the number of refreshes. If you do not specify the number of refreshes but specify the refresh interval, the refresh operation does not automatically stop. To stop the referesh operation, press the q key to exit the top command.
[-d]: specifies the refresh interval.
Example
Run the following command to view the resource usage of each process in the system. The command collects statistics about the resource usage of each process every 2 seconds for five times and then exits.
top -n 5 -d 2The following command output is returned. For information about the parameters, see the Fields in the system information summary and process list section of the "Common Linux commands" topic.
top - 17:27:13 up 27 days,  3:13,  1 user,  load average: 0.02, 0.03, 0.05
Tasks:  94 total,   1 running,  93 sleeping,   0 stopped,   0 zombie
%Cpu(s):  0.3 us,  0.1 sy,  0.0 ni, 99.5 id,  0.0 wa,  0.0 hi,  0.0 si,  0.1 st
KiB Mem:   1016656 total,   946628 used,    70028 free,   169536 buffers
KiB Swap:        0 total,        0 used,        0 free.   448644 cached Mem
PID USER      PR  NI    VIRT    RES    SHR S %CPU %MEM     TIME+ COMMAND
1 root        20   0   41412   3824   2308 S  0.0  0.4   0:19.01 systemd
2 root        20   0       0      0      0 S  0.0  0.0   0:00.04 kthreadd
In interactive mode, press the following keys to adjust the output of the top command:
Press the P key to sort processes in descending order of CPU utilization. This way, you can quickly find the processes that consume a large amount of CPU resources in the system.
Press the M key to sort processes by memory usage. If a CPU has multiple cores, press the 1 key to display the load status of each CPU core.
To view the program file that corresponds to each process ID (PID), run the
ll /proc/<PID>/execommand. Replace <PID> with the actual PID.To terminate a non-business process that consumes a large amount of CPU resources, run the top command in interactive mode. For more information, see the Terminate a process by PID section of the "Common Linux commands" topic.
Run the vmstat command to view system resource usage
The Virtual Memory Statistics (vmstat) command is used to report virtual memory statistics. You can use it to view operating system metrics, such as virtual memory, processes, and CPU usage.
Common options
The vmstat syntax is as follows:
vmstat [-n] [delay [count]] Option | Description |
-n | Displays the column header only once. |
[delay] | The time interval between output updates. If you do not specify this option, only one report is printed. |
[count] | The number of output updates. If you specify the [delay] option but do not specify this option, the command infinitely runs. To stop the vmstat command, press |
Examples
Run the following command to report CPU usage for each process for four times at 1-second intervals:
vmstat -n 1 4A command output similar to the following one is returned:
procs -----------memory---------- ---swap-- -----io---- -system-- ------cpu-----
 r  b   swpd   free   buff  cache   si   so    bi    bo   in   cs us sy id wa st
 1  0      0 2684984 310452 2364304    0    0     5    17   19   35  4  2 94  0  0
 0  0      0 2687504 310452 2362268    0    0     0   252 1942 4326  5  2 93  0  0
 0  0      0 2687356 310460 2362252    0    0     0    68 1891 4449  3  2 95  0  0
 0  0      0 2687252 310460 2362256    0    0     0     0 1906 4616  4  1 95  0  0
Fields in the command output:
r: the number of threads waiting to be processed by the CPU. A CPU can process only one thread at a time. A larger value indicates a slower system.
us: the percentage of CPU time spent in user mode. A high value indicates that the user process spends a significant amount of CPU time. If the value exceeds 50%, optimize the program algorithm or code.
sy: the percentage of CPU time spent in kernel mode.
wa: the percentage of CPU time spent waiting for I/O. A high value indicates a significant I/O wait time, which may be caused by a large number of random disk accesses or a bottleneck in disk performance.
id: the percentage of CPU time spent in an idle state. If the value remains at 0 and the sy value is twice the us value, a CPU resource shortage occurs.
Resolve the issue
The following table describes the causes of and solutions to the high CPU utilization issue.
Problem description | Cause | Solution |
An abnormal user program or process consumes a large amount of CPU resources for a long time, resulting in high CPU utilization and load. | An abnormal program or process consumes a large amount of CPU resources during runtime. |
|
A normal user program or process consumes a large amount of CPU resources for a long time, resulting in high CPU utilization and load. | A normal program or process consumes a large amount of CPU resources during runtime. | If a CPU performance bottleneck exists, use one of the following methods to remove the bottleneck based on your business scenario:
|
A business program or process occasionally consumes a large amount of CPU resources for a short time. | Business programs are not optimized to resolve the issue of excessive CPU resource usage in special scenarios, such as encryption, decryption, and high concurrency. | Optimize business programs. |
No program or process consumes a large amount of CPU resources, but the overall CPU utilization is high and the CPU load is low. | The CPU performance required for the normal operation of services on an instance outstrips the CPU performance of the instance. | If a CPU performance bottleneck exists, upgrade the instance type. For more information, see Change instance types. |
FAQ
What do I do if the CPU utilization is low but the CPU load is high?
Problem description
No business programs are running on a Linux ECS instance. The top command shows that the CPU utilization is low, but the CPU load (load average) is high, as shown in the following figure.
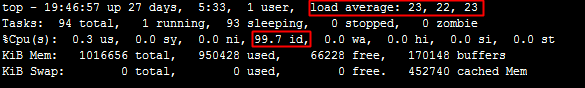
Cause
A large number of zombie processes exist in the system.
The load average is used to evaluate the CPU load. A higher value indicates a longer task queue and more tasks waiting to be executed.
Solution
Run the ps -axjf command to check whether the system has processes in the D+ state, which is an uninterruptible sleep state.
Processes in this state cannot be terminated or automatically exit. To resolve the issue, you can restore the dependency resources of the processes or restart the system.

What do I do if the kswapd0 process consumes a large amount of CPU resources?
Problem description
A Linux ECS instance is stuck. The top command shows that the kswapd0 process consumes 99% of the CPU resources.

Cause
Constant page swapping by the system causes the consumption of a large amount of CPU resources.
The kswapd0 process is a virtual memory management process responsible for page swapping. When the physical memory of the ECS instance is insufficient, the kswapd0 process performs a page-swapping operation. The operation consumes a large amount of CPU resources.
Solution
Modify the vm.swappiness kernel parameter to control the size of the swap space.
What do I do if the CPU utilization is too high but no abnormal process is found by running the top command?
Problem description
The CPU utilization of a Linux ECS instance reached 100%. You cannot find the processes that consume a large amount of CPU resources by running commands, such as top and htop.
Cause
The issue may be caused by a virus or malicious program.
Solution
View monitoring data collected by CloudMonitor.
Go to ECS console - Instance.
On the Instance page, click the ID of the instance that you want to query.
Click the Monitoring tab. On the OS Monitoring tab, view the CPU utilization of the ECS instance and record the points in time when the CPU utilization became high.
Query the command modification records of the Linux ECS instance.
In this example, the top command is used. Replace the command with the actual command that you want to query, such as ps.
Use Workbench to connect to the Linux ECS instance over SSH.
Run the following command to check the command file status of the Linux system:
sudo stat /usr/bin/topThe following command output is returned:
  File: /usr/bin/top
  Size: 134864          Blocks: 264        IO Block: 4096   regular file
Device: 253,3   Inode: 658539      Links: 1
Access: (0755/-rwxr-xr-x)  Uid: (    0/    root)   Gid: (    0/    root)
Access: 2025-04-15 13:45:41.240874421 +0800
Modify: 2024-09-26 16:44:05.000000000 +0800
Change: 2025-04-15 13:45:24.822222315 +0800
 Birth: 2025-04-15 13:45:24.804221600 +0800
Take note of the following parameters:
Access: the point in time when the file was last accessed.
Modify: the point in time when the file content was last modified.
Change: the point in time when the file metadata was changed.
Birth: the point in time when the file was created.
View information about the command package.
Alibaba Cloud Linux, CentOS, Red Hat Enterprise Linux, or Fedora
Query the path of the command file.
sudo which topThe following command output is returned:
/usr/bin/topQuery the package to which the top command belongs.
sudo rpm -qf /usr/bin/topThe following command output indicates that the top command belongs to the procps-ng package:
procps-ng-3.3.10-28.el7.x86_64Use the package manager to verify the package.
sudo rpm -V procps-ngIf the command output is empty, the command file is normal.
If the following command output is returned, the command file was modified:
??5?????? c /etc/sysctl.conf??5??????indicates that the file attributes, such as permissions, owner, and size, do not match the original installation record.cindicates that the file content was modified.
Ubuntu or Debian
Query the path of the command file.
sudo which topThe following command output is returned:
/usr/bin/topQuery the package to which the top command belongs.
sudo dpkg -S /usr/bin/topThe following command output indicates that the top command belongs to the procps package:
procps: /usr/bin/topUse the package manager to verify the package.
sudo dpkg -V procpsIf the command output is empty, the command file is normal.
If the following command output is returned, the command file was modified:
??5?????? c /etc/sysctl.conf??5??????indicates that the file attributes, such as permissions, owner, and size, do not match the original installation record.cindicates that the file content was modified.
NoteIf the command file is verified as normal but you still suspect that the top command was modified by a malicious program, you can use the package manager to re-install the package. For more information, see the Use package management tools to manage software section of the "Manage software repositories for Linux instances" topic.
Check whether the instance is connected to an invalid domain name.
Run the following command to view the connections of a network interface:
iftop -i [$Device] -n -PNoteReplace [$Device] with the network interface controller (NIC) used by the current system, such as eth0.
The following command output is returned. If you did not connect to crypto-pool.fr, crypto-pool.fr is an invalid domain name.

Determine whether the ECS instance is infected with a virus or attacked by a malicious program based on the results of the preceding steps. If the ECS instance has abnormal processes that consume excessive CPU resources and has network communications with invalid domain names or IP addresses after a specific point in time, resolve the issue.
Create snapshots to back up data on the ECS instance.
Use valid snapshots created before the instance was infected with a virus or attacked by a malicious program to restore the instance data. For more information, see Roll back a disk by using a snapshot.
Use Security Center to scan for and remove the virus or malicious program and harden the security of the ECS instance. For more information, see Host Protection.
References
What do I do if a Windows instance has high CPU utilization?
For information about how to use the atop tool to collect CPU metrics for anomaly analysis, see Use the atop tool to monitor Linux metrics.